
22
Jun
By the Numbers
Dan Clausen owns greatest season in NBL history

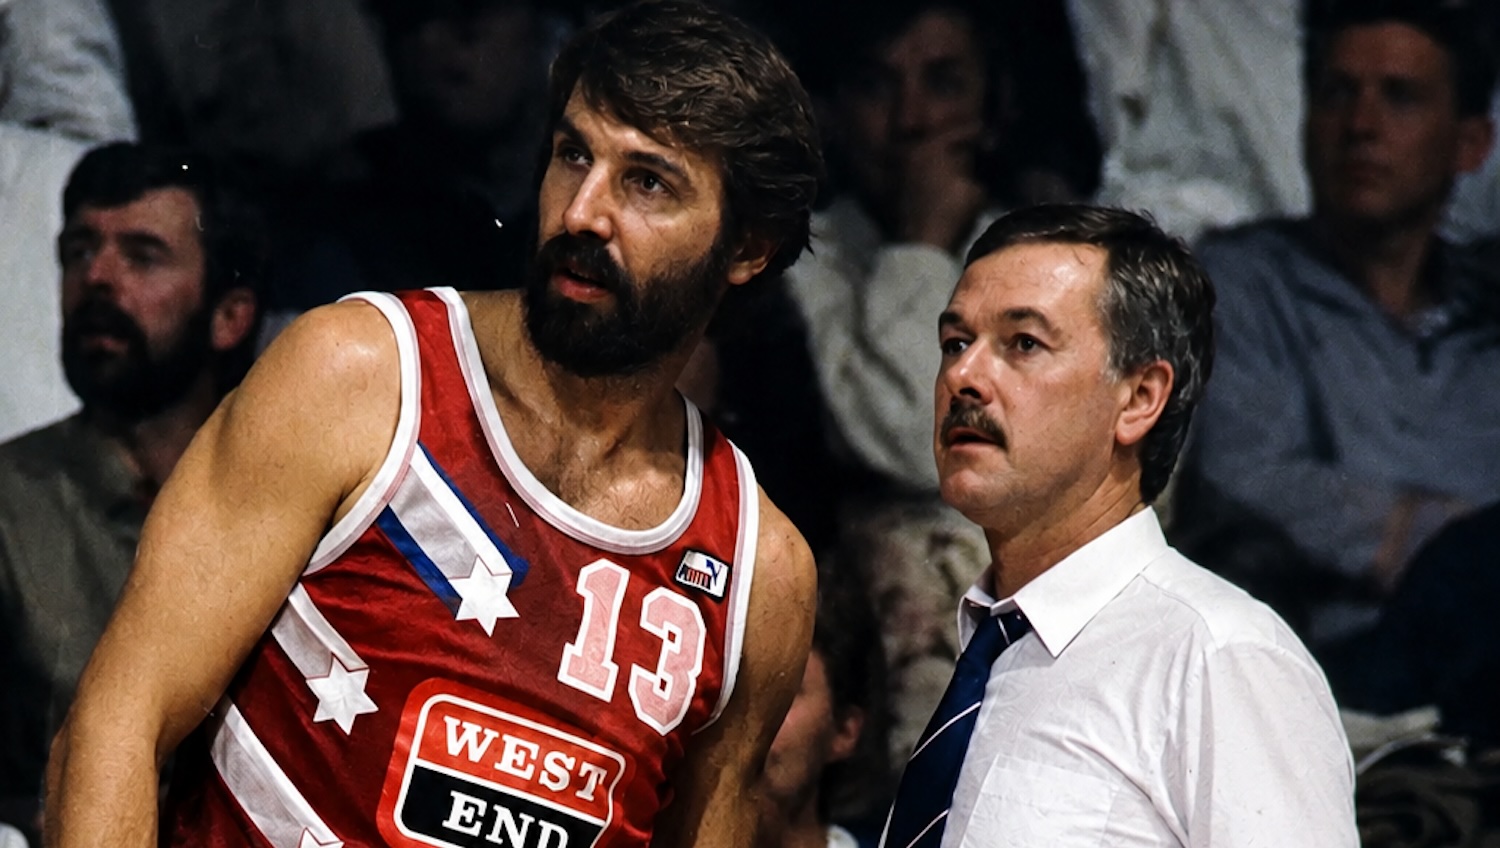
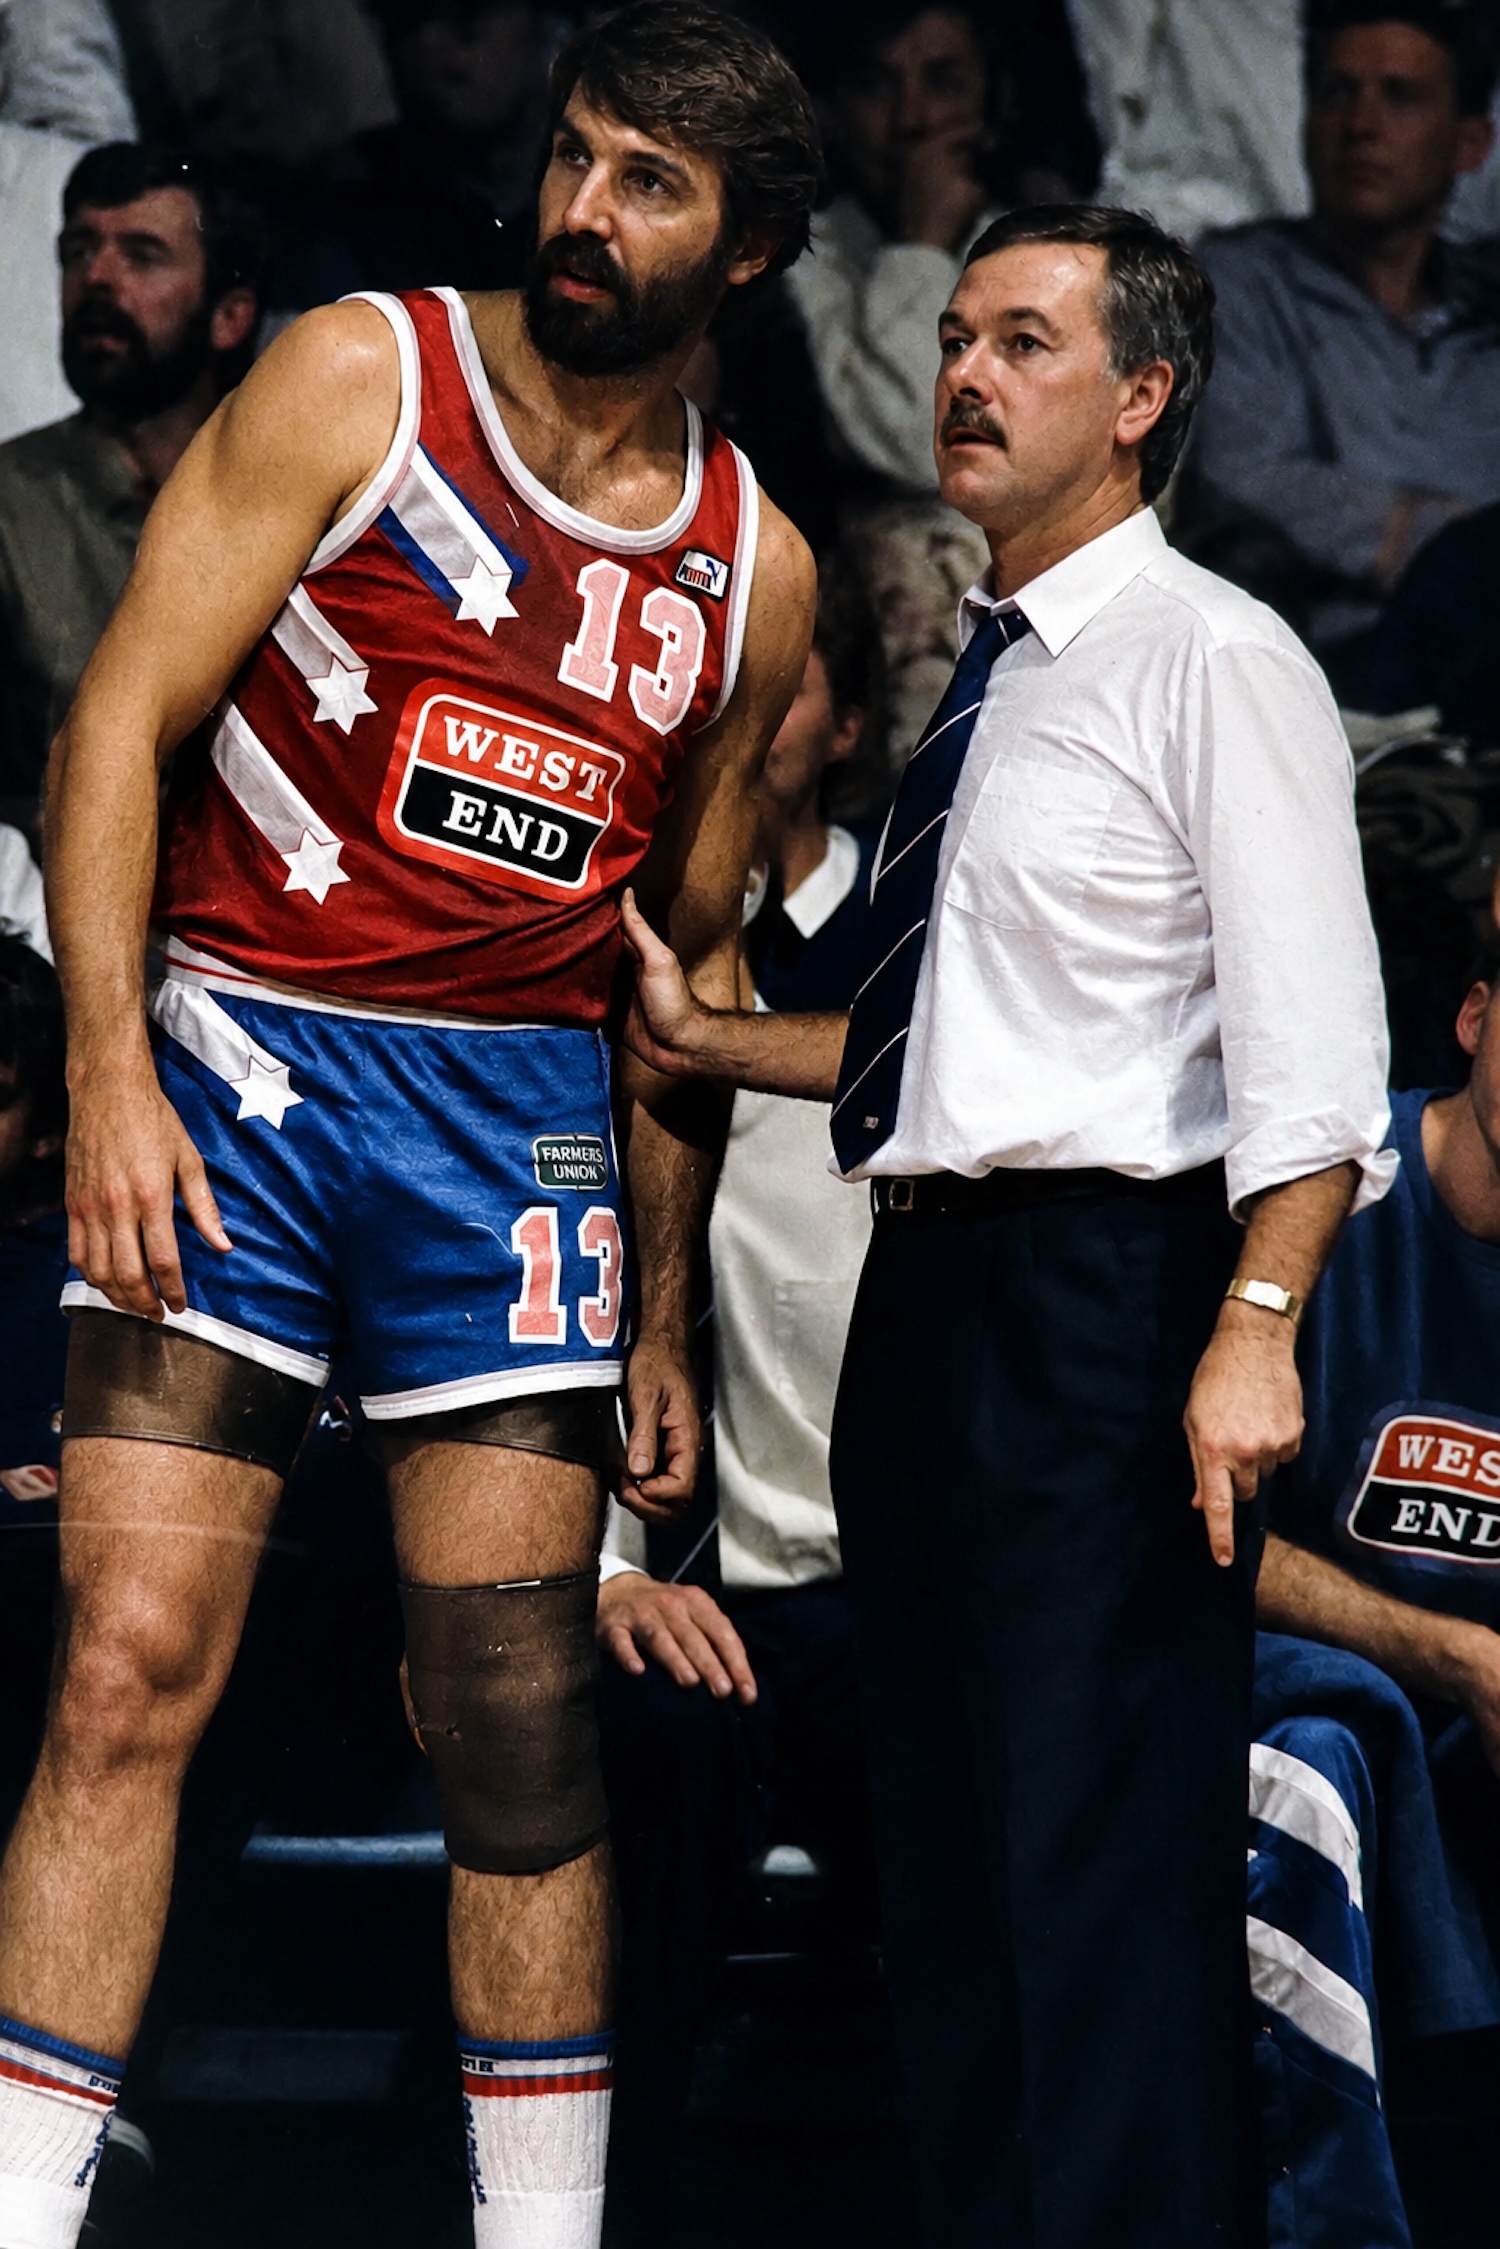
Adelaide 36ers big man Dan Clausen delivered arguably the most dominant season in NBL history in 1984. Photo: Facebook / Enhanced and colorised using AI.
Import Dan Clausen's 1984 campaign ranks No.1 among the greatest statistical seasons in NBL history.
- Complete history of every NBL player EVER!
- A definitive history of Australia's NBL
- Ranked: The Top 25 NBL Players of All-Time
The numbers are staggering.
More than 2,100 players have suited up in the NBL since 1979, but only a handful have produced seasons so statistically dominant they stand above the rest.
Using basketball.com.au's Every NBL Player Ever archive, we ranked the greatest all-round individual seasons based on production across the five major box score categories – points, rebounds, assists, steals and blocks – highlighting players who impacted every aspect of the game rather than excelling in just one.
Dan Clausen owns the greatest statistical season in NBL history, and the fifteen behind him describe a decade the league has never repeated.
Ranked on efficiency per game, Clausen's 1984 season for the Adelaide 36ers stands alone at 41.4. He averaged 30.5 points, 18.0 rebounds and 3.2 blocks across 24 games, and both the rebounding and the shot-blocking are the highest figures anywhere in the top 15.
Andrew Gaze is the other name that defines the list. He holds four of the fifteen places, twice as many as anyone else, and he arrives by a completely different route. Gaze never averaged more than 8.2 rebounds in any of those four seasons, and in 1991 he took just 4.4 a game, the lowest rebounding figure in the entire ranking.
What he did instead was score at a rate nobody in the league has approached since: 44.1 points a game in 1987, then 38.8 in 1991, 37.6 in 1990 and 34.5 in 1989, with between 5.8 and 7.2 assists beside them.
Between them, Clausen and Gaze lead every category in the table. Gaze tops points, assists and steals. Clausen tops rebounds and blocks. Nobody else leads a single column.
Gaze's 1987 season ranks second at 39.4, and he played only 20 games in it, fewer than any other season on the list. James Crawford's 1987 for Perth is the opposite case, the longest campaign here at 32 games, and it still ranks third.
Eight players hold all fifteen places and five of them appear more than once. Scott Fisher makes it in consecutive seasons with North Melbourne, Mark Davis twice with Adelaide, Norman Taylor twice with Illawarra. Clausen is the only player in the list to do it for two different clubs, Adelaide in 1984 and Perth in 1985.
Kendal Pinder's 1985 for the Sydney Kings is the wildest season in the top 15. He gave the ball away 6.5 times a game, comfortably the most of anyone here, and the efficiency formula punishes every one of them. He still ranks fifth, on 33.5 points and 17.8 rebounds.
Most Dominant Seasons in NBL History