2

Oct

By the Numbers

'Charity Gripe': NBL27 free throws worst in 14 seasons

Written By

basketball.com.au

'Charity Gripe': NBL27 free throws worst in 14 seasons
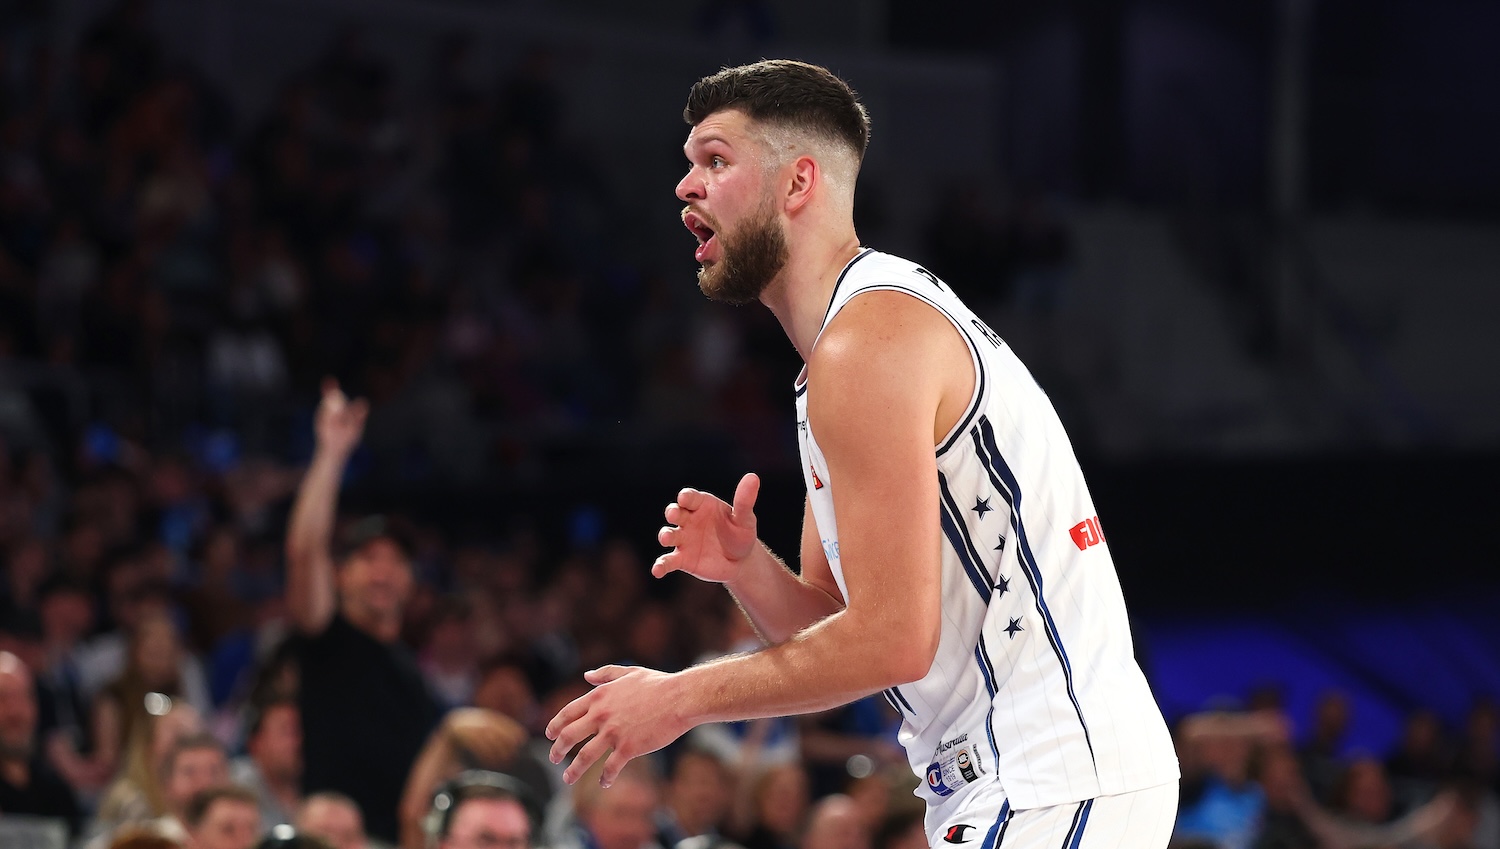

Adelaide 36ers import Nick Rakocevic reacts after fouling out following a contest with Melbourne United’s Sam Waardenburg during their round one NBL match at John Cain Arena in Melbourne on September 19, 2026. Photo: Daniel Pockett/Getty Images

NBL27's free throw percentage is 71.9 per cent, the worst it's been in the past 13 years

Toggle ON/OFF for SuperCoach NBL Prices

NBL27 free throw shooting has started cold.

After 16 games the league is shooting 71.9 per cent from the line, below the past 20 seasons' average of 73.1 per cent, and the misses are already deciding games.

It's the worst percentage since the 2012-13 season (71.8%) but there is still a long way to go. Between 2007 and 2009, the league average was 70.6%.

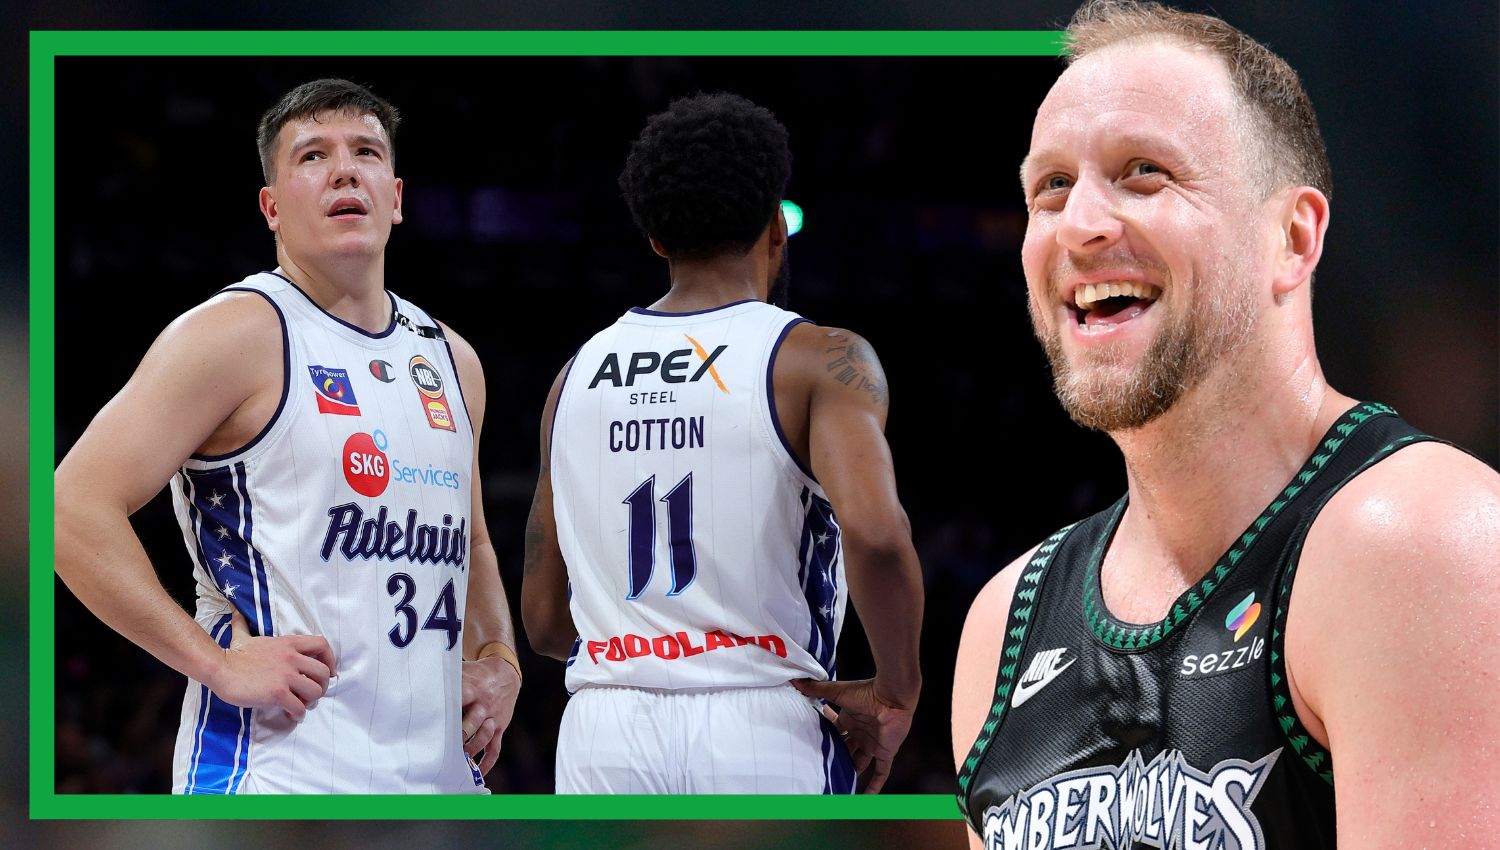
Bryce Cotton ($473,900) sets the standard for volume in NBL27. The Adelaide star has made 22 of 25 (88.0 per cent), while Kendric Davis ($436,000) has gone to the line 26 times and made 21, level with Cole Anthony ($300,000) for the most attempts among the 20 players below.

South East Melbourne Phoenix pair Akech Aliir ($125,300) and Skylar Mays ($277,000) top the list at 10 from 11 (90.9 per cent), just ahead of Illawarra's Milton Doyle ($274,700) (9 from 10) and the Breakers' Parker Jackson-Cartwright ($405,200) (15 from 17).

At the other end, Nick Rakocevic ($188,400) has made five of 14 (35.7 per cent), the worst return of any player with at least 10 attempts. Sam Waardenburg ($277,500) (5 from 12) and Arnas Velicka ($277,000) (8 from 17) are next, and Velicka's Bullets are shooting 62.5 per cent as a team.

Nobody has paid for it more than Melbourne United. Waardenburg and Anthony are a combined 22 from 38, and United's 66.2 per cent has left them 5.1 points short across three games of what the same attempts return at the 20-season rate. Thursday night's 84-82 loss in Hobart, where United made 25 of 41, is one of three NBL27 results that would flip if both teams had shot the long-term average.

Taran Armstrong ($304,700), who hit the winner in that game, is 7 from 14 himself.

Cairns are the best club at the line at 80.0 per cent, but Sydney have gained the most from it, 3.9 points above the long-term rate. Illawarra are last at 60.7 per cent, and they are the only club yet to win a game.


NBL27’s best free-throw shooters

16 games · minimum 10 attempts · 25 players qualify · league 71.9%
1Akech AliirPhoenix101190.9%$125,300$131,300+$6,000
2Skylar MaysPhoenix101190.9%$277,000$272,200-$4,800
3Milton DoyleHawks91090.0%$274,700$267,900-$6,800
4Parker Jackson-CartwrightBreakers151788.2%$405,200$435,200+$30,000
5Bryce Cotton36ers222588.0%$473,900$473,800-$100
6Dejan VasiljevicBreakers101283.3%$144,000$157,600+$13,600
7Elijah PepperWildcats91181.8%$202,700$232,800+$30,100
8Jaylon BrownTaipans91181.8%$277,000$264,400-$12,600
9Kendric DavisKings212680.8%$436,000$436,000$0
10Kelan MartinHawks81080.0%$277,000$262,700-$14,300
Start price is the player’s SuperCoach price at the start of the season; SC price is his price now, in green if it has risen and red if it has fallen. Free throws from the NBL’s official box scores. Ties go to the player with more attempts.

NBL27’s worst free-throw shooters

16 games · minimum 10 attempts · 25 players qualify · league 71.9%
1Nick Rakocevic36ers51435.7%$188,400$229,000+$40,600
2Sam WaardenburgUnited51241.7%$277,500$277,500$0
3Arnas VelickaBullets81747.1%$277,000$277,000$0
4Taran ArmstrongJackJumpers71450.0%$304,700$304,700$0
5Xavier CooksKings81457.1%$308,000$308,000$0
6Nate HintonBullets101758.8%$277,000$277,000$0
7David JohnsonJackJumpers71163.6%$232,900$232,900$0
8Cole AnthonyUnited172665.4%$300,000$300,000$0
9Zylan Cheatham36ers162466.7%$339,500$336,500-$3,000
10Kristian DoolittleWildcats81266.7%$317,500$325,200+$7,700
With 25 qualifiers after 16 games, one big night still moves a player several places.

NBL27 free throws: who it has helped and hurt

16 games · league 71.9% against a 20-season average of 73.1% · five clubs with a different record at that rate
Kings369/8977.5%+3.9+1.33-03-0
Taipans436/4580.0%+3.1+0.81-31-3
Wildcats345/5976.3%+1.9+0.62-10-3
Phoenix340/5375.5%+1.2+0.41-21-2
Breakers456/7574.7%+1.2+0.32-23-1
36ers357/7873.1%0.00.02-13-0
JackJumpers358/8072.5%-0.5-0.22-11-2
United349/7466.2%-5.1-1.71-22-1
Bullets340/6462.5%-6.8-2.32-12-1
Hawks334/5660.7%-6.9-2.30-30-3
+/- is points scored at the line above or below what the same attempts return at the 20-season league average of 73.1%. Rows tinted gold are clubs whose win-loss record changes at that rate.
The results that flip, and how this is worked out
At 73.1%, three of 16 results flip: Round 2, Wildcats 98 36ers 97 becomes a 36ers win by 1.6; Round 2, Wildcats 97 Breakers 93 becomes a Breakers win by 0.3; Round 3, JackJumpers 84 United 82 becomes a United win by 4.3.
The comparison swaps both teams’ free-throw makes for what their attempts return at 73.1%, and keeps every other point as scored. It does not account for how a game would have been played differently, such as late fouling, so treat a flip of a point or two as a coin toss rather than a verdict.
The 20-season average is every free throw made divided by every free throw attempted from 2006-07 to 2025-26 (92,093 of 125,947), not an average of the season percentages. The best season in that span was 2020-21 at 75.9%; the lowest was 2007-08 and 2008-09 at 70.6%.
NBL27 figures come from the NBL’s official box scores for every completed game, and each team’s points are checked against the final score. Earlier seasons come from our Every NBL Player season totals.

NBL free-throw percentage by season

2006-07 to 2026-27 · all games including finals · 20-season average 73.1%
2026-27 so far48467371.9%
2025-265,6027,48474.9%
2024-255,1456,89274.7%
2023-245,1907,04773.6%
2022-234,6636,34173.5%
2021-224,1475,58274.3%
2020-214,4945,92475.9%
2019-204,1445,46675.8%
2018-193,7434,99774.9%
2017-183,8245,12074.7%
2016-173,9345,24275.0%
2015-163,8675,28773.1%
2014-153,5454,92572.0%
2013-143,7264,96375.1%
2012-133,1944,44671.8%
2011-123,9065,40772.2%
2010-114,0115,54372.4%
2009-103,6395,10071.4%
2008-095,7838,18970.6%
2007-087,65410,83970.6%
2006-077,88211,15370.7%
2006-07 to 2025-2692,093125,94773.1%
2026-27 is the season so far. The footer row is all twenty completed seasons combined.

Related Articles

See all articles
basketball.com.au logo

Stay in the Loop with the latest Hoops

Patty Mills
Ezi Magbegor
Dyson Daniels
Jade Melbourne
Montrezl Harrell