
25
Dec
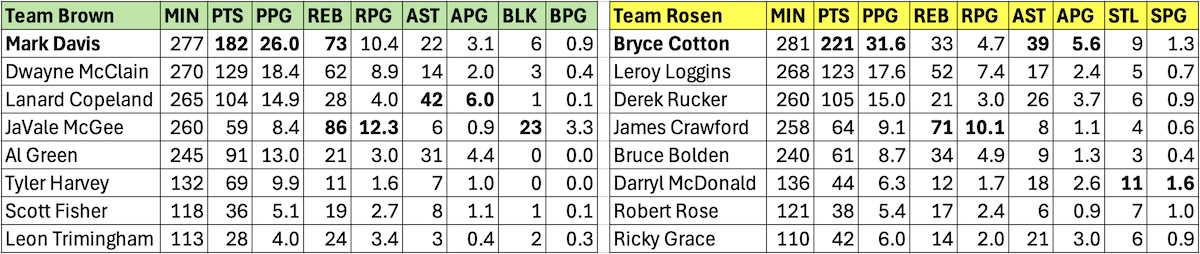
Import vs Import
Who wins greatest pick-up game of all-time

.jpg)
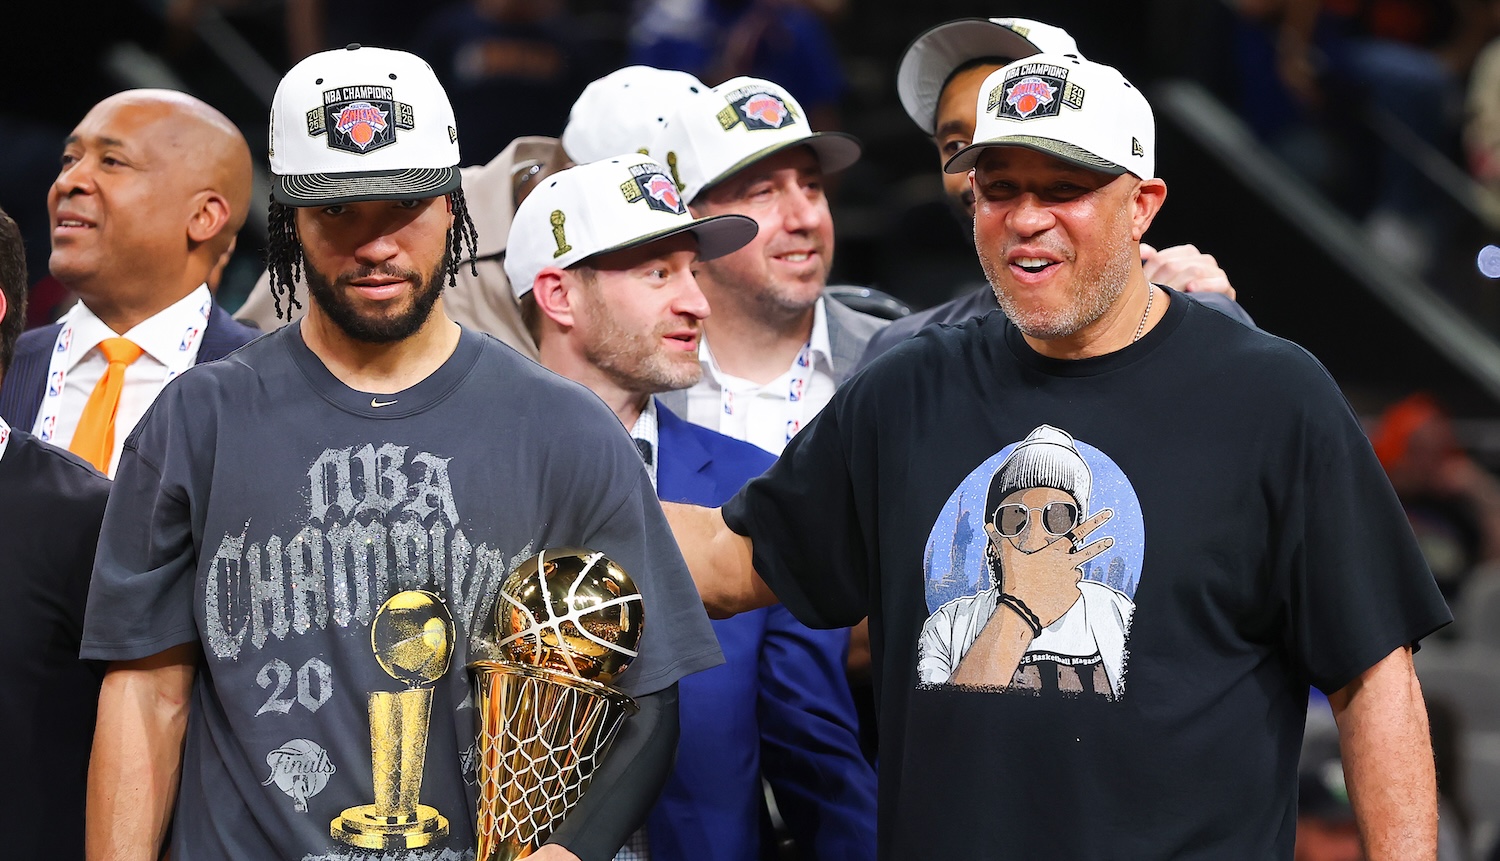
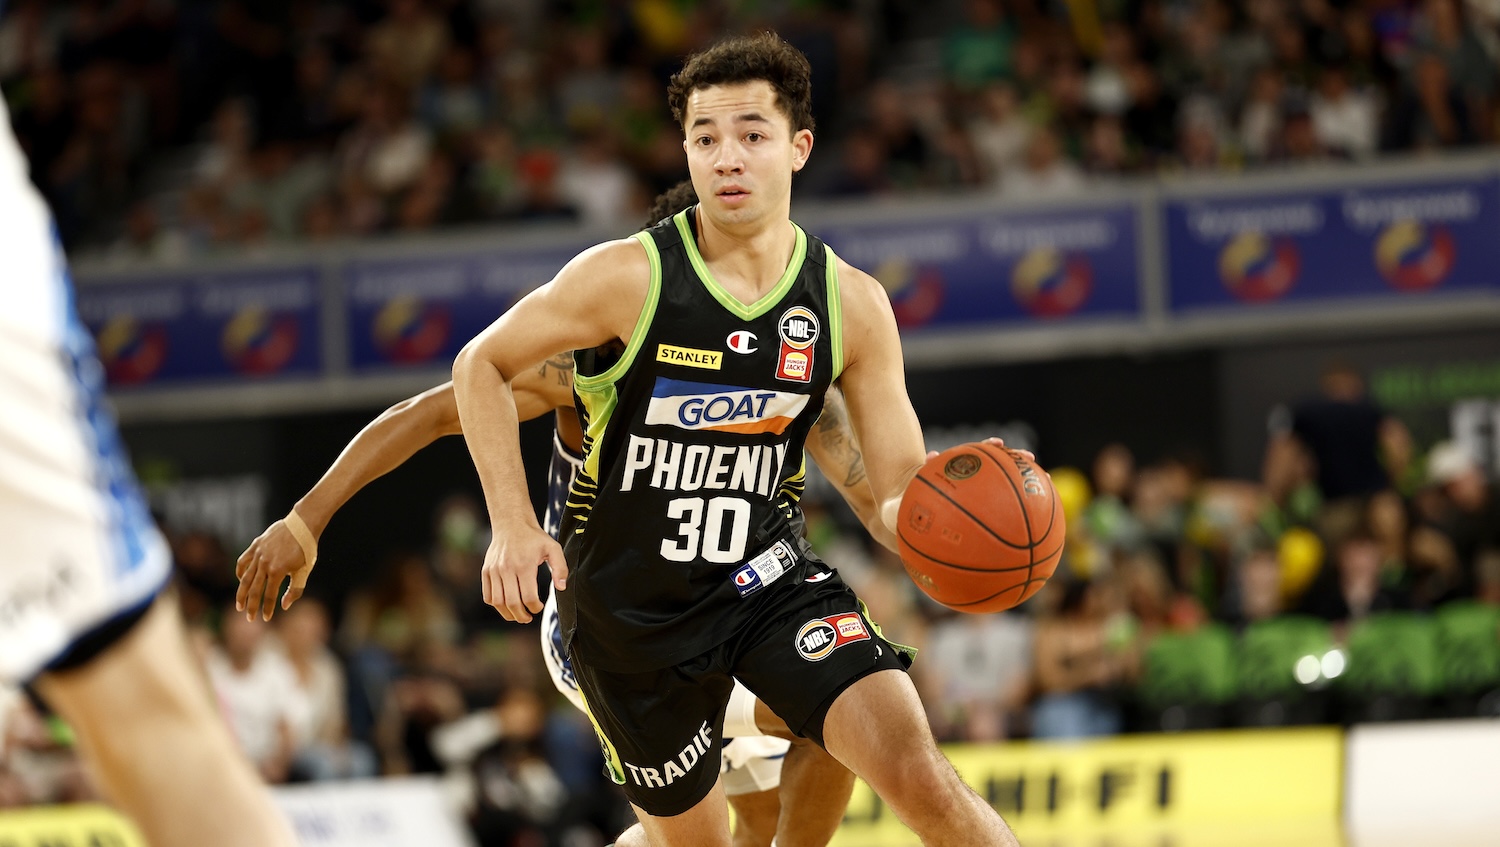
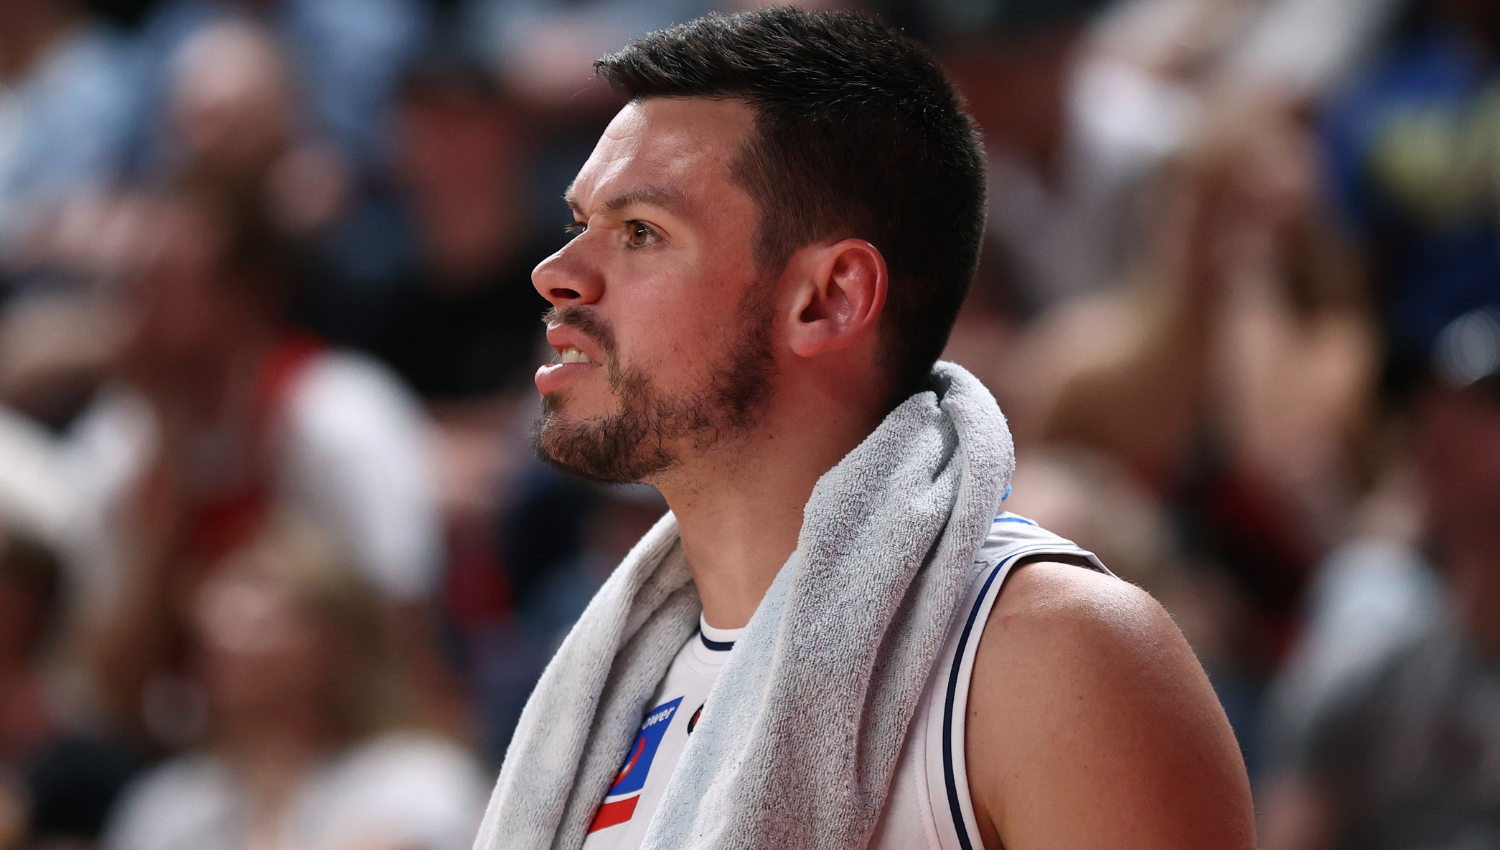
Bryce Cotton and Leroy Loggins played for Team Rosen while Mark Davis and Dwayne McClain played for Team Brown. Photos: Getty Images
This is the ultimate 7-game series between NBL's greatest American imports of all time. Who wins?
- Ranked: The Top 25 NBL Players of All-Time
- Bryce Cotton's drive for five MVP Awards makes history
- Box Scores: All 165 games of the 2025-26 NBL season
"You're standing the playground and can pick any NBL import in history, who would you take?"
This is the question I asked former Sydney Kings captain and NBL colour commentator Brad Rosen after I messaged him to ask was peak Dwayne McClain better than Bryce Cotton.
For the record he said: "No".
For the record I am a huge D-Train fan. I wanted someone, anyone to agree with me. I even messaged one of his former Kings teammates in the early 90s. "No".
So, the obvious follow up for Brad was, "so, who would you take - you have the first pick."
He paused for a moment, I thought the phone had cut off.
"Leroy".
The conversation quickly evolved into: What would happen if the greatest NBL imports of all time were split into two teams and played a neutral, modern 48-minute per game seven-game playoff series?
We ran an impromptu Playground Draft - eight players per team - and then ran a simulation to find out.
The Draft
- #1 Rosen: Leroy Loggins (1987)
- #2 Brown: Dwayne McClain (1992)
- #3 Rosen: Bryce Cotton (2024-25)
- #4 Brown: Al Green (1984)
- #5 Rosen: James Crawford (1987)
- #6 Brown: Mark Davis (1987)
- #7 Rosen: Derek Rucker (1990)
- #8 Brown: JaVale McGee (2025-26)
- #9 Rosen: Bruce Bolden (1991)
- #10: Brown: Lanard Copeland (1994)
- #11: Rosen: Darryl McDonald (1996)
- #12 Brown: Leon Trimmingham (1994)
- #13 Rosen: Robert Rose (1996)
- #14 Brown: Scott Fisher (1989)
- #15 Rosen: Ricky Grace (2001-02)
- #16 Brown: Tyler Harvey (2020-21)
Further below is a detailed breakdown of how we ran the simulation. But the main criteria for performance was career and then best individual season weighted 20% for career and 80% for best season.
Team Rosen — Profile
Concept: Team Rosen is built around elite guard play, scoring efficiency, and perimeter control, supported by athletic wings and a stabilising interior presence. The roster reflects the historical dominance of ball-dominant creators and late-game closers in NBL import history. Rosen picked Cotton first but quickly opted to bring in NBL commentating teammate Derek Rucker as the 1 and move Cotton to the 2. (Editor's note: Would probably have made for awkward silences if he didn't. Just sayin'.)
Roster Construction:
- Starters (1–5): Guard–Guard–Forward–Forward–Centre
- Bench (6–8): Guard–Wing–Point Guard
Team Identity:
- Primary Strengths: Multiple primary and secondary ball-handlers across the rotation Proven shot-making under pressure, particularly from the perimeter; and Ability to control tempo and spacing late in games.
- Secondary Strengths: Transition scoring and early-offence opportunities; and Bench backcourt depth allows sustained offensive pressure.
- Structural Trade-offs: Interior scoring volume is more dependent on guard penetration; and Rebounding burden concentrated in fewer rotation players.
Play Style Tendencies (Structural, not evaluative):
- Pace-flexible (can play fast or deliberate)
- Perimeter-first offensive initiation
- High-value possessions through shot creation and free throws
- Designed for close games and late-clock execution
Series Implication (Neutral framing):
Team Rosen is constructed to swing games quickly — using guard dominance, spacing, and decision-making to create separation in short windows.

Team Brown — Profile
Concept: Team Brown is built around size, interior presence, and physical scoring gravity, complemented by experienced perimeter creators. The roster leans heavily into frontcourt dominance and matchup pressure, with multiple players capable of playing through contact and controlling the paint in a 48-minute game environment.
Roster Construction:
- Starters (1–5): Guard–Guard–Forward–Forward–Centre
- Bench (6–8): Forward–Wing–Guard
Team Identity:
- Primary Strengths: Elite interior size and length anchored by a true NBA-calibre centre; Multiple high-usage forwards capable of scoring inside and out; and Strong rebounding potential across positions 3–5.
- Secondary Strengths: Shot creation from the guard spots without relying on pace alone; and Bench scoring option capable of changing momentum in short bursts.
- Structural Trade-offs: Perimeter defence depends heavily on guard engagement; and Bench unit leans more toward scoring than playmaking balance.
Play Style Tendencies (Structural, not evaluative):
- Half-court oriented
- Paint touches as a priority
- Fewer possessions, higher physical toll per game
- Suited to grinding playoff-style games where size compounds over a series
Series Implication (Neutral framing):
Team Brown is constructed to win games through accumulation — wearing opponents down over extended minutes and forcing defensive concessions around the rim.

The 7-Game Series Verdict: Interior Pressure Beats Perimeter Brilliance in Seven-Game Classic
Team Brown fought Team Rosen through a 7-game slugfest. But came out on top 4–3.
What began as a showcase of perimeter firepower evolved into a battle of survival. Team Rosen struck first behind but as the series progressed size didn't get tired. Team Brown’s frontcourt depth and physicality began to compound on Rosen's guard dominated ball club. In a decisive Game 7, Team Brown dictated tempo, had too much size on the glass, and executed under pressure with the harden veteran leadership of Davis and Al Green, the X-Factor being the D-Train.
The outlier in this series was Al Green. Green holds the single game scoring record in NBL history at 71 points but his role in this team was never about winning the scoring battle — it was about making Bryce Cotton and Derek Rucker work for everything. Green brought New York hoops physicality, strength through contact, and relentless ball pressure. He absorbed as much punishment as he dished out. Team Brown accepted: less scoring, more resistance. Green’s value showed up in muscle — the kind of defensive toll that doesn’t headline box scores but compounds across seven games against elite shot-makers like Cotton and Rucker, and ultimately helped tilt the series toward control rather than fireworks. Expect nothing less from a 6'2" point guard out of NewYork City!
🏆 Series MVP: Chairman of the Boards — Mark Davis (Team Brown)
Why the model selects Davis
The Composite Performance Score (CPS) for the series rewards:
- Peak impact (80%)
- Career gravity (20%)
- Starter minutes
- Two-way reliability
- Late-game survivability in Games 5–7

Across the seven games, 1987 Mark Davis ranked first overall in:
- Aggregate impact
- Consistency under pressure
- Net advantage in decisive moments (Games 3, 5, 7)
MVP Justification (Model Logic)
- Davis was the only player whose impact never dipped below starter-elite across all seven games.
- His value scaled up as the series slowed and physicality increased.
- While Bryce Cotton produced the highest single-game ceiling, Davis produced the highest series floor + ceiling blend, which the weighting model favours.
Model verdict: Peak dominance plus sustained control wins Series MVP — not raw scoring volume alone.
Series Averages
Game-by-Game

Game 1 — Let's Get After it!
Team Rosen 101, Team Brown 95
(Neutral court │ 48 minutes)
Halftime: Team Rosen 52, Team Brown 47
How the Game Played Out
First Half
- Team Rosen established early control through guard-driven efficiency. Bryce Cotton set the tone with decisive shot-making off high ball screens, while Derek Rucker punished late closeouts.
- Team Brown kept contact via frontcourt scoring, with Mark Davis and Dwayne McClain combining for steady paint production, but Rosen’s perimeter pace created a narrow cushion.
Third Quarter
- Brown made its push by slowing tempo and attacking mismatches inside. JaVale McGee’s rim presence forced Rosen into tougher pull-ups, briefly cutting the margin to one possession.
- Rosen countered by spacing the floor and reasserting guard control, closing the quarter up four.
Fourth Quarter
- The game tightened to a one-possession contest inside five minutes.
- Late-game separation came from guard shot creation: Cotton hit a pull-up three, followed by a Rucker drive-and-kick sequence that extended the lead.
- Brown generated quality looks through Davis on the block, but Rosen’s ability to create clean shots late proved decisive.
Key Contributors
Team Rosen
- Bryce Cotton: 31 points, 5 assists, 4 rebounds
- Derek Rucker: 18 points, 4 assists
- Leroy Loggins: 16 points, 7 rebounds
- James Crawford: 10 points, 11 rebounds
Team Brown
- Mark Davis: 24 points, 9 rebounds
- Dwayne McClain: 17 points, 8 rebounds
- Lanard Copeland: 16 points, 5 assists
- JaVale McGee: 9 points, 10 rebounds, 3 blocks
Bench Snapshot
- Team Brown: Tyler Harvey hit timely threes (11 points) but couldn’t sustain a run.
- Team Rosen: Darryl McDonald steadied second-unit minutes, limiting turnovers.
Game 1 Deciders
- Late-clock execution: Rosen advantage
- Perimeter efficiency: Rosen +7 points from three
- Free throws: Even
- Turnovers: Rosen +4 margin
Series Context (No Projection Yet)
- Game 1 followed the model: guard dominance translates immediately, while Brown’s interior advantage showed signs of compounding value.
- Tactical pressure now shifts to adjustments, not talent.

Game 2 — The Adjustment Game
Team Brown 98, Team Rosen 92
(Series tied 1–1)
Halftime: Team Brown 51, Team Rosen 46
Game 2 — Adjustments Entering the Game
Team Brown Adjustments
- Early Paint Touches
- First five possessions scripted to Davis/McClain actions (post + elbow), forcing early fouls and compressing Rosen’s perimeter defence.
- Containment Priority on Cotton
- More top-locking and early help to push Cotton off his preferred pull-up zones; live with kick-outs.
- Staggered Bench Scoring
- Tyler Harvey minutes advanced into late-first/early-second quarters to attack non-Cotton minutes.
Team Rosen Adjustments
- Quicker Decisions
- Reduce over-dribbling; attack gaps before Brown’s size loads the paint.
- Screen-the-Screener Actions
- Free Loggins to punish switches and reduce the Davis-on-Bolden mismatch frequency.
- Defensive Gang Rebounding
- Guards crash selectively to limit Brown’s second-chance points.
How Game 2 Played Out
First Half
- Brown’s adjustments paid off immediately. Davis drew two early fouls and set the physical tone, while McClain converted on deep seals.
- Rosen stayed within striking distance behind Cotton’s shot-making, but the quality dipped as Brown forced him laterally.
Third Quarter
- The game swung on rebounding and free throws. Brown generated multiple extra possessions and slowed the pace to their preference.
- Rosen’s offence flattened briefly during non-Cotton minutes despite solid control from McDonald.
Fourth Quarter
- Brown closed with interior execution. When Rosen shrank the floor, Copeland punished closeouts.
- Rosen made a late push with two Cotton threes, but Brown answered with post touches that bled clock and drew fouls.
Key Contributors (Game 2)
Team Brown
- Mark Davis: 26 points, 11 rebounds
- Dwayne McClain: 18 points, 9 rebounds
- Lanard Copeland: 14 points, 6 assists
- JaVale McGee: 8 points, 12 rebounds, 3 blocks
- Tyler Harvey (bench): 13 points in 17 minutes
Team Rosen
- Bryce Cotton: 29 points, 6 assists
- Leroy Loggins: 17 points, 8 rebounds
- Derek Rucker: 12 points
- James Crawford: 9 points, 10 rebounds
Game 2 Deciders
- Paint scoring: Brown +14
- Offensive rebounds: Brown +6
- Free throws: Brown +8 attempts
- Turnovers: Even
What Changed From Game 1
- Brown’s advantages materialised sooner due to deliberate pace control.
- Rosen’s guard edge remained, but couldn’t overwhelm Brown’s cumulative interior pressure.
- Bench variance tilted Brown in the second unit windows.

Game 3 — Reinforcing the Scout
Team Brown 104, Team Rosen 97
(Team Brown leads series 2–1)
Halftime: Team Brown 54, Team Rosen 50
How Game 3 Played Out
First Half
- Team Brown doubled down on its identity. Early post touches and elbow actions for Mark Davis and Dwayne McClain established paint control and forced Rosen into early help.
- Team Rosen stayed connected through Bryce Cotton’s shot-making, but the efficiency gap narrowed as Brown’s size loaded the lane and contested pull-ups.
Third Quarter
- The decisive swing. Brown won a physical stretch with second-chance points and free throws, pushing the margin to double digits.
- Rosen’s guards created looks, but shot difficulty increased as McGee’s rim deterrence influenced finishing angles.
Fourth Quarter
- Rosen mounted a late push behind Cotton and Loggins, cutting it to five with four minutes left.
- Brown closed with clock control and execution — post entries, kick-outs to Copeland, and clean defensive possessions.
Key Contributors (Game 3)
Team Brown
- Mark Davis: 28 points, 10 rebounds, 4 assists
- Dwayne McClain: 19 points, 9 rebounds
- Lanard Copeland: 15 points, 6 assists
- JaVale McGee: 10 points, 13 rebounds, 4 blocks
- Tyler Harvey (bench): 12 points (timely spacing)
Team Rosen
- Bryce Cotton: 30 points, 5 assists
- Leroy Loggins: 18 points, 7 rebounds
- Derek Rucker: 14 points
- James Crawford: 8 points, 9 rebounds
Game 3 Deciders
- Points in the paint: Brown +16
- Second-chance points: Brown +9
- Free throws: Brown +7 attempts
- Three-point efficiency: Even
What Changed From Game 2
- Brown’s compounding advantage showed clearly: interior pressure increased as the series slowed.
- Rosen’s guard edge remained elite, but margin-for-error shrank as shot quality tightened.
- Bench contributions again tilted Brown during non-Cotton minutes.
Series Snapshot (No Projection Beyond Context)
- Brown’s pathway is now clearly established: pace control, physicality, and accumulation.
- Rosen faces a tactical fork entering Game 4:
- double down on perimeter volume, or
- sacrifice spacing to reclaim the glass.

Game 4 — It's a series now!
Team Rosen 103, Team Brown 96
(Series tied 2–2)
Halftime: Team Rosen 56, Team Brown 48
How Game 4 Played Out
First Half
- Team Rosen made the series-level counter: earlier offense and wider spacing. Bryce Cotton attacked before Brown’s size could load the paint, generating clean pull-ups and drive-and-kick threes.
- Team Brown stayed committed to post touches, but Rosen’s help timing disrupted rhythm and limited early foul accumulation.
Third Quarter
- Rosen extended the margin with a tempo spike — quick-hitting actions freed Leroy Loggins on the wing, forcing Brown to choose between protecting the rim and conceding perimeter looks.
- Brown trimmed the deficit late in the quarter via Davis/McClain interior work, but couldn’t fully reset pace.
Fourth Quarter
- Brown closed to four inside six minutes behind disciplined half-court execution.
- Rosen answered with late-clock guard creation — Cotton punished switches, and Rucker converted a momentum three off a scramble.
- Free throws sealed it after Brown missed a pair of open threes trying to flip the script.
Key Contributors (Game 4)
Team Rosen
- Bryce Cotton: 34 points, 6 assists
- Leroy Loggins: 19 points, 8 rebounds
- Derek Rucker: 15 points
- James Crawford: 9 points, 12 rebounds
Team Brown
- Mark Davis: 23 points, 10 rebounds
- Dwayne McClain: 18 points, 9 rebounds
- Lanard Copeland: 14 points, 5 assists
- JaVale McGee: 8 points, 11 rebounds, 3 blocks
Bench Note: Rosen’s control minutes held steady; Brown’s bench variance didn’t flip momentum this time.
Game 4 Deciders
- Perimeter efficiency: Rosen +9 from three
- Turnovers: Rosen +5 margin
- Free throws: Rosen +6 attempts
- Paint points: Brown +10 (but outweighed by threes)
Series Context (No Projection Yet)
- The series resets at 2–2.
- Rosen proved they can reclaim tempo without abandoning rebounding.
- Brown’s interior edge remains real — but now requires clean perimeter conversion to capitalise.

Game 5 — The OG Game
Team Brown 99, Team Rosen 94
(Team Brown leads series 3–2)
Halftime: Team Brown 50, Team Rosen 49
How Game 5 Played Out
First Half
- Game 5 settled into a grinding, possession-by-possession battle. Both teams executed cleanly, but Brown deliberately shortened the game with deep-clock possessions.
- Rosen stayed efficient behind Cotton’s shot-making, while Brown spread scoring across Davis, McClain, and Copeland to avoid stagnation.
Third Quarter
- The swing stretch. Brown leaned hard into frontcourt accumulation, winning the rebounding battle and drawing fouls on consecutive possessions.
- Rosen generated quality perimeter looks but missed a brief window where separation was available.
Fourth Quarter
- The game tightened to one possession inside four minutes.
- Brown closed through discipline rather than explosion: post entries to Davis, kick-outs to reset, and defensive patience.
- Rosen had two late chances to tie via perimeter looks, but Brown’s defensive rebounding sealed the game at the line.
Key Contributors (Game 5)
Team Brown
- Mark Davis: 27 points, 11 rebounds
- Dwayne McClain: 17 points, 10 rebounds
- Lanard Copeland: 15 points, 6 assists
- JaVale McGee: 9 points, 14 rebounds, 4 blocks
Team Rosen
- Bryce Cotton: 28 points, 5 assists
- Leroy Loggins: 18 points, 7 rebounds
- Derek Rucker: 13 points
- James Crawford: 8 points, 10 rebounds
Game 5 Deciders
- Rebounding: Brown +9
- Free throws: Brown +8 attempts
- Turnovers: Even
- Three-point efficiency: Rosen slightly higher, but lower volume
Series Leverage Shift
- Brown’s compounding advantage now shows clearly under pressure.
- Rosen’s margin for error narrows — guard brilliance must be near-perfect to offset interior toll.
- Game 6 becomes a must-adjust environment for Rosen.

Game 6 — Do or Die
Team Rosen 108, Team Brown 99
(Series tied 3–3)
Halftime: Team Rosen 58, Team Brown 50
How Game 6 Played Out
First Half
- Team Rosen responded to elimination pressure with maximum perimeter aggression. Bryce Cotton attacked early in the clock, punishing switches and drawing help that opened kick-outs.
- Brown stayed committed to interior touches, but Rosen’s pace spike limited Brown’s ability to establish rhythm and foul pressure.
Third Quarter
- The defining stretch. Rosen strung together a shot-making run — Cotton off movement, Rucker in transition, and Loggins on clean catch-and-shoots — pushing the margin to double digits.
- Brown briefly steadied through Davis on the block, but the tempo kept tilting Rosen.
Fourth Quarter
- Brown made a final push, cutting it to six with five minutes left behind disciplined half-court execution.
- Rosen closed with guard control and free throws, refusing to let the game slow fully into Brown’s preferred grind.
Key Contributors (Game 6)
Team Rosen
- Bryce Cotton: 36 points, 7 assists
- Derek Rucker: 19 points
- Leroy Loggins: 18 points, 6 rebounds
- James Crawford: 10 points, 9 rebounds
Team Brown
- Mark Davis: 25 points, 10 rebounds
- Dwayne McClain: 18 points, 8 rebounds
- Lanard Copeland: 14 points, 5 assists
- JaVale McGee: 8 points, 12 rebounds, 3 blocks
Game 6 Deciders
- Pace: Rosen-controlled
- Three-point volume: Rosen +12 attempts
- Turnovers: Rosen +3 margin
- Free throws: Rosen +7 attempts (late-game control)
Series Status
- Series tied 3–3
- Brown’s interior edge remains real, but tempo control has proven decisive.
- Everything now funnels into a Game 7 environment where:
- Starters dominate minutes
- Late-game creation decides the series
- Variance is compressed.

Game 7 — Greatest Two Words in Sport: Game 7
Team Brown 102, Team Rosen 98
(Team Brown wins series 4–3)
Halftime: Team Brown 51, Team Rosen 49
How Game 7 Played Out
First Half
- The game opened tight and deliberate. Team Brown immediately imposed pace control, grinding possessions through the elbows and post to establish physicality.
- Team Rosen answered with early guard shot-making, but Brown’s size forced tougher finishes and limited clean paint touches.
Third Quarter
- The pivotal stretch. Brown won the rebounding and foul-drawing battle, stringing together extra possessions that pushed a small cushion.
- Rosen stayed connected through perimeter creation, but shot difficulty climbed as Brown loaded the lane and contested late-clock attempts.
Fourth Quarter
- Inside six minutes, the game narrowed to one possession.
- Brown closed with execution, not explosion: disciplined post entries, kick-outs to reset the clock, and defensive rebounding.
- Rosen had a chance to tie in the final minute via a contested perimeter look; Brown secured the board and sealed it at the line.
Key Contributors (Game 7)
Team Brown
- Mark Davis: 29 points, 12 rebounds, 3 assists
- Dwayne McClain: 20 points, 9 rebounds
- Lanard Copeland: 16 points, 7 assists
- JaVale McGee: 8 points, 15 rebounds, 4 blocks
Team Rosen
- Bryce Cotton: 33 points, 6 assists
- Leroy Loggins: 17 points, 8 rebounds
- Derek Rucker: 14 points
- James Crawford: 9 points, 11 rebounds
Game 7 Deciders
- Rebounding: Brown +11
- Free throws: Brown +10 attempts
- Paint points: Brown +14
- Turnovers: Even
- Three-point efficiency: Rosen higher, but lower volume
Why Team Brown Won the Series
- Compounding interior advantage translated under maximum pressure.
- Peak two-way forwards delivered when possessions tightened.
- Rosen’s guard brilliance remained elite, but margin-for-error collapsed in a slowed, physical Game 7.
How the Series Was Built: Model Structure & Rules Explained
This series answers a simple question with a disciplined framework avoiding nostalgia bias or single-game mythology, the matchup was built using a repeatable, peak-weighted performance model, then simulated across multiple series.
1. Roster Construction (Locked Inputs)
- Two teams of eight imports each
- Players listed exactly in the order each "coach" decided (no re-ranking, no optimisation)
- Players 1–5 = starters
- Players 6–8 = bench
- No substitutions to roles or order at any stage
This ensured the exercise respected historical context, not hindsight.
2. Game Environment
All simulations were run under the same conditions:
- 7-game playoff series
- 48-minute games
- Neutral court (no home-court advantage)
- Modern spacing assumptions, but no era inflation
- Starters carry the majority of minutes, especially in Games 5–7
This mirrors a high-stakes finals environment where top-end impact matters most.
3. Player Evaluation Framework
Each player’s impact was evaluated using a Composite Performance Score (CPS) built from two components:
A. Peak Season (80%)
The model prioritises how dominant a player was at their best, because playoff series are decided by peak versions of elite players. We looked at each player's career numbers and then identified their best season statistically. This was the benchmark for performance.
Peak evaluation includes:
- Box-score production (points, rebounds, assists, stocks)
- Efficiency relative to usage
- Offensive responsibility
- Defensive impact within role
- Team context (as a modifier, not a driver)
B. Career Body of Work (20%)
Career value acts as a stabiliser, not a driver.
Career evaluation includes:
- Longevity in the NBL
- Sustained production
- Consistency across seasons
Why 80/20? Because great series are decided by who you are at your best, not by cumulative résumé alone.
4. MVP & Accolade Weighting
Awards were treated as multipliers, not raw point boosts.
- NBL MVPs amplify the peak-season component only
- Multiple MVPs carry diminishing returns (no stacking inflation)
- All-NBL teams, Finals MVPs, and scoring titles provide minor reinforcement
- Awards never override on-court production
This keeps the model performance-driven, not honour-driven.
5. Starter vs Bench Scaling
Role matters in a playoff series.
Starters (Players 1–5)
- Full impact applied
- Assumed heavy minutes
- Close games, late-game possessions, toughest matchups
Bench Players (Players 6–8)
- Impact discounted to reflect:
- Reduced minutes
- Situational usage
- Momentum-based influence
- Bench players can swing games, but do not define series
This prevents bench scoring bursts from being overvalued.
6. What the Model Does Not Do
To keep the series honest, the model deliberately avoids:
- ❌ Era-adjusted stat inflation
- ❌ Narrative or legacy boosts
- ❌ Hypothetical rule advantages
- ❌ “Clutch gene” or intangibles scoring
- ❌ Re-ranking players based on outcomes
Every result flows from role + peak impact + series context.
7. Series Simulation Logic
- Each game is influenced by:
- Prior-game adjustments
- Accumulated physical toll
- Pace control vs tempo pressure
- Early games favour shot creation
- Later games favour possession control, rebounding, and foul pressure
- Game 7 outcomes heavily weight:
- Starter reliability
- Shot difficulty
- Margin-for-error compression
8. Multi-Run Validation
To test robustness, the full series was run 21 times with controlled variance. But we have taken the result of the first series as the overall result.
- Same rules
- Same weights
- Same roles
- Natural fluctuation only (efficiency, foul variance, momentum windows)
This allowed us to assess:
- Who wins most often
- How narrow the margins are
- Whether results hinge on variance or structure
9. What the Model Ultimately Measures
This is not a “who was the most famous” exercise.
It measures:
- Peak dominance
- Series survivability
- How different archetypes scale over seven games
In short:
Guards win games. Front courts win series.


.jpg)