
24
Feb
In-depth Analysis
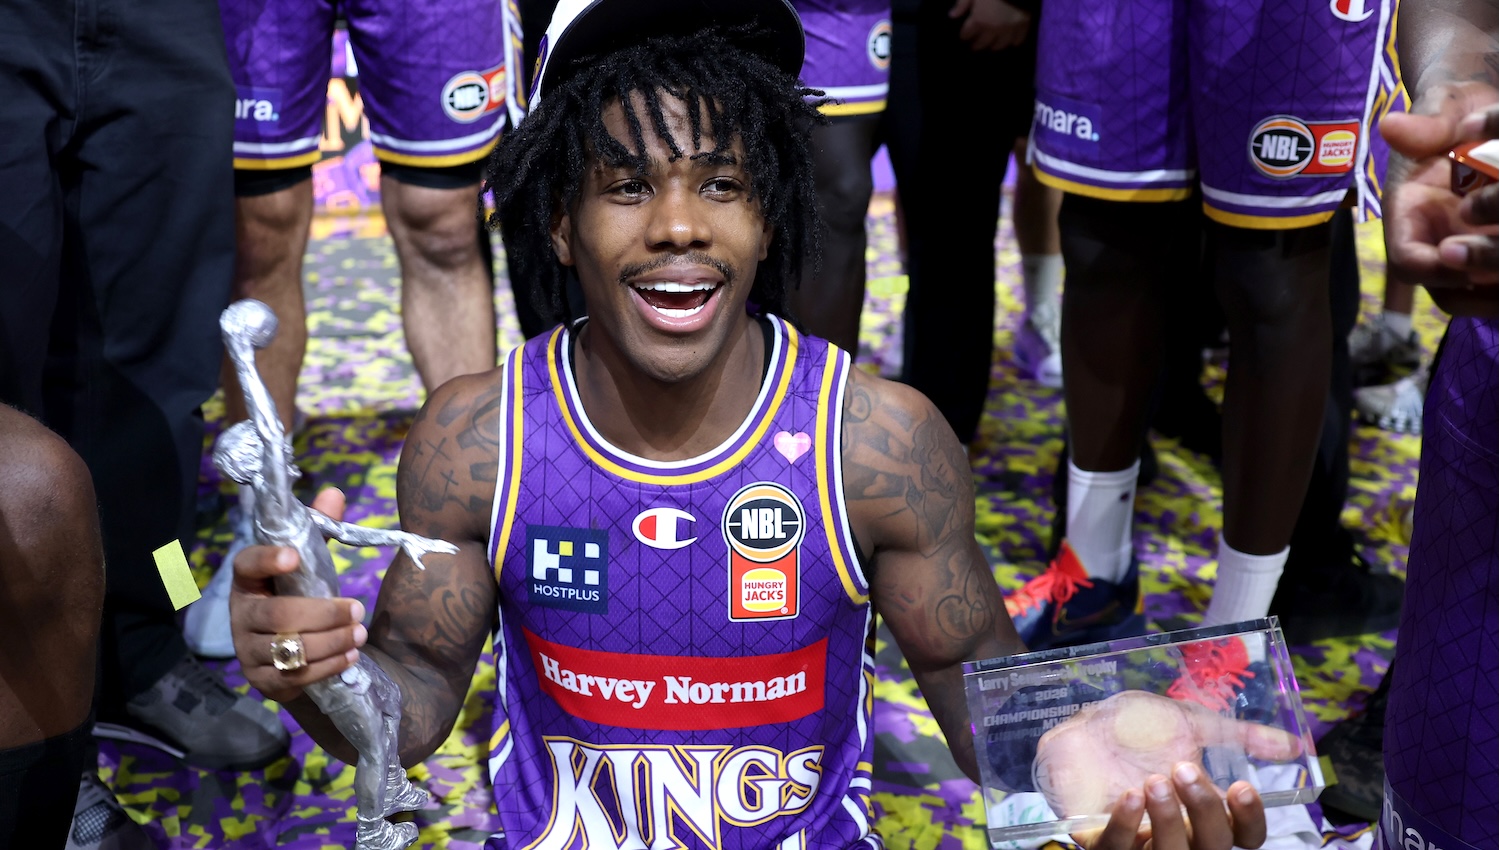
Why Kendric Davis should have won his first MVP


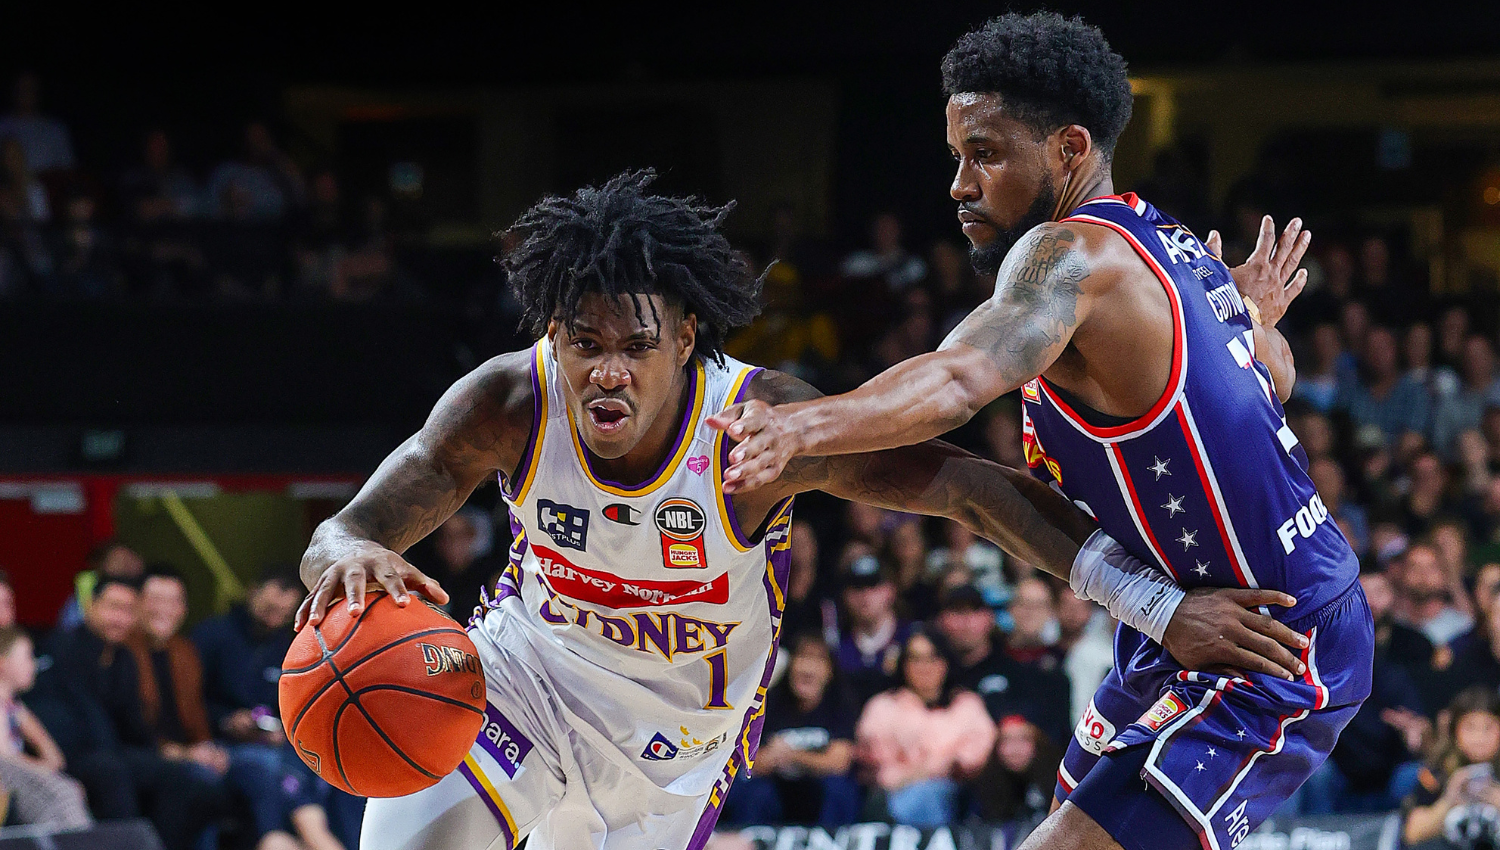
Bryce Cotton of the 36ers and Kendric Davis of the Kings challenge for the ball during the round 18 NBL match between Sydney Kings and Adelaide 36ers at Qudos Bank Arena on January 25, 2026 in Sydney. Photo: Jeremy Ng/Getty Images
Highlights
Kendric Davis vs Bryce Cotton? Who was the real MVP? Our analysis shows it was Kings star Davis
- Davis averaged 26.2 PPG against Top Six teams; Cotton averaged 22.2 PPG.
- Sydney went 3–1 head-to-head; Davis outscored Cotton 23.8 to 16.3 PPG.
- Davis posted a 5.0 assist-to-turnover ratio vs Adelaide; Cotton recorded 2.2.
- Cotton averaged 28.6 PPG vs Bottom Four; Davis averaged 22.6 PPG.
- Weighted Defensive Difficulty Index was nearly identical – Cotton 25.0, Davis 24.6.
The best player on the best team is Kendric Davis but he's not NBL26 MVP.
Cotton, 33, claimed his sixth MVP in Melbourne last night (Monday, February 23, 2026) in an extraordinarily tight race, 96 votes to 94.
Only Andrew Gaze has more with seven.
He was the best player on the second best team but Adelaide 36ers (23-10) head coach Mike Wells declared the debate was “over” and Bryce Cotton was the MVP a couple of weeks ago.
This declaration from Wells came after Cotton had just led the 36ers back on the road, defeating the New Zealand Breakers 92-89 on February 15, 2026.
"If it's not over tonight, then tell me what the definition (of MVP) is," Wells said.
"(Bryce) played 40 minutes, scored 42 points, guarded the other team's best player, did everything.
"Most Valuable Player to his team. This thing is over.
"If you're not voting for Bryce Cotton, who's been the best player in this league since the day he got here, I want to know why.
"I want to see the votes. It's not even close. The MVP race is over today.”
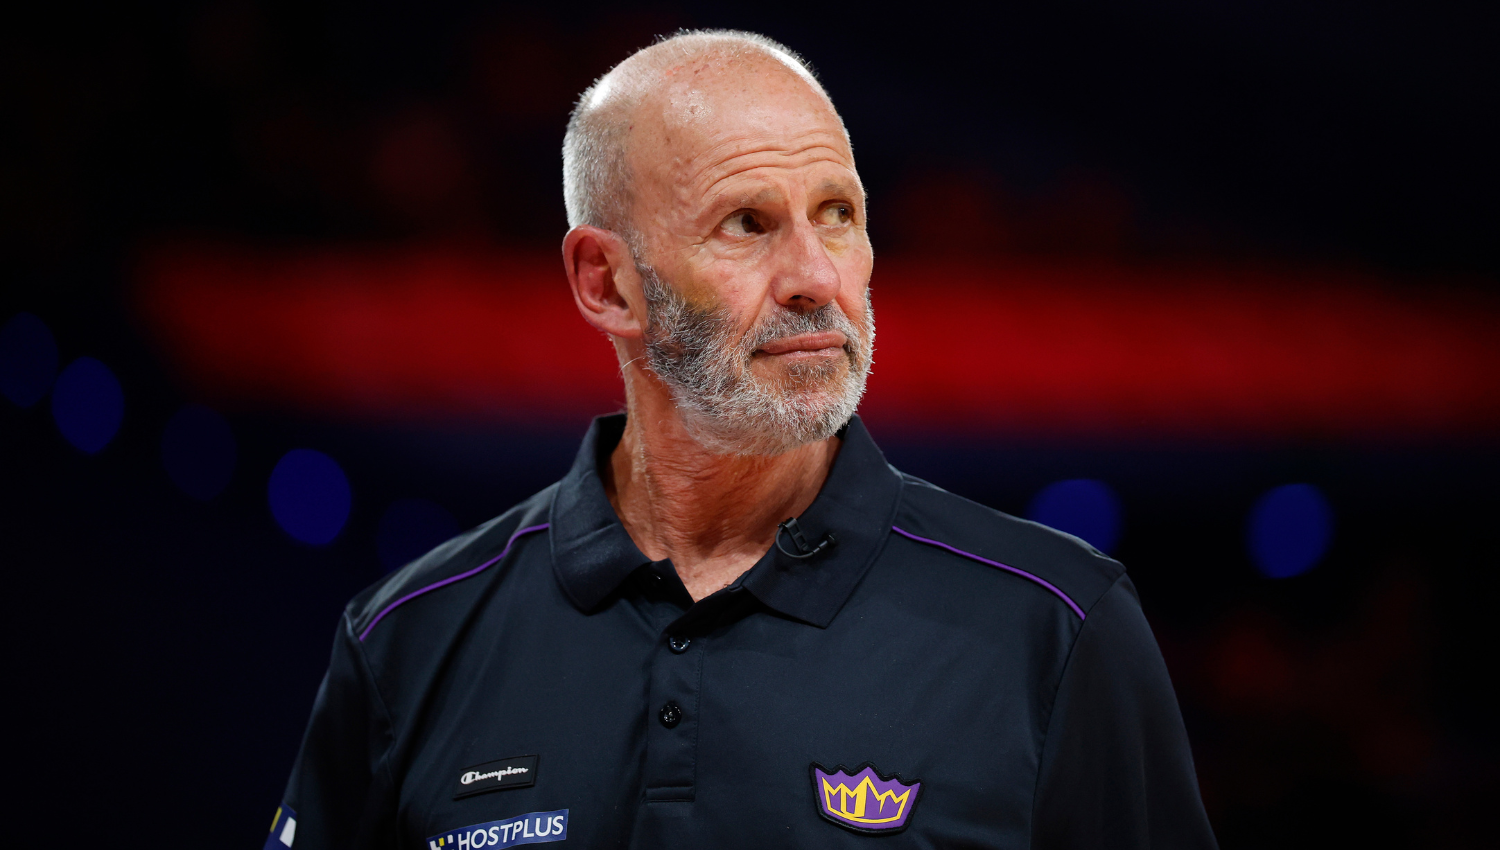
Responding directly to Wells' comments a day later, Sydney Kings head coach and now seven-time NBL Coach of the Year Brian Goorjian replied: “I was taken aback by it, and I don’t want to get into this because this has kind of put me in a position after yesterday listening, and I've gotta bring my guy into this.
“There was such a strong push, but in our mind, we started this season, and no one had us in the top four coming in, and what's happened? We've played them (Adelaide) four times and beaten them three.
“He's (Davis) having a season that goes down in Sydney Kings' history as one of the best individual performances of any player to put on this uniform, and then this whole aspect of him as a leader and him as a person all of that came across as well.”
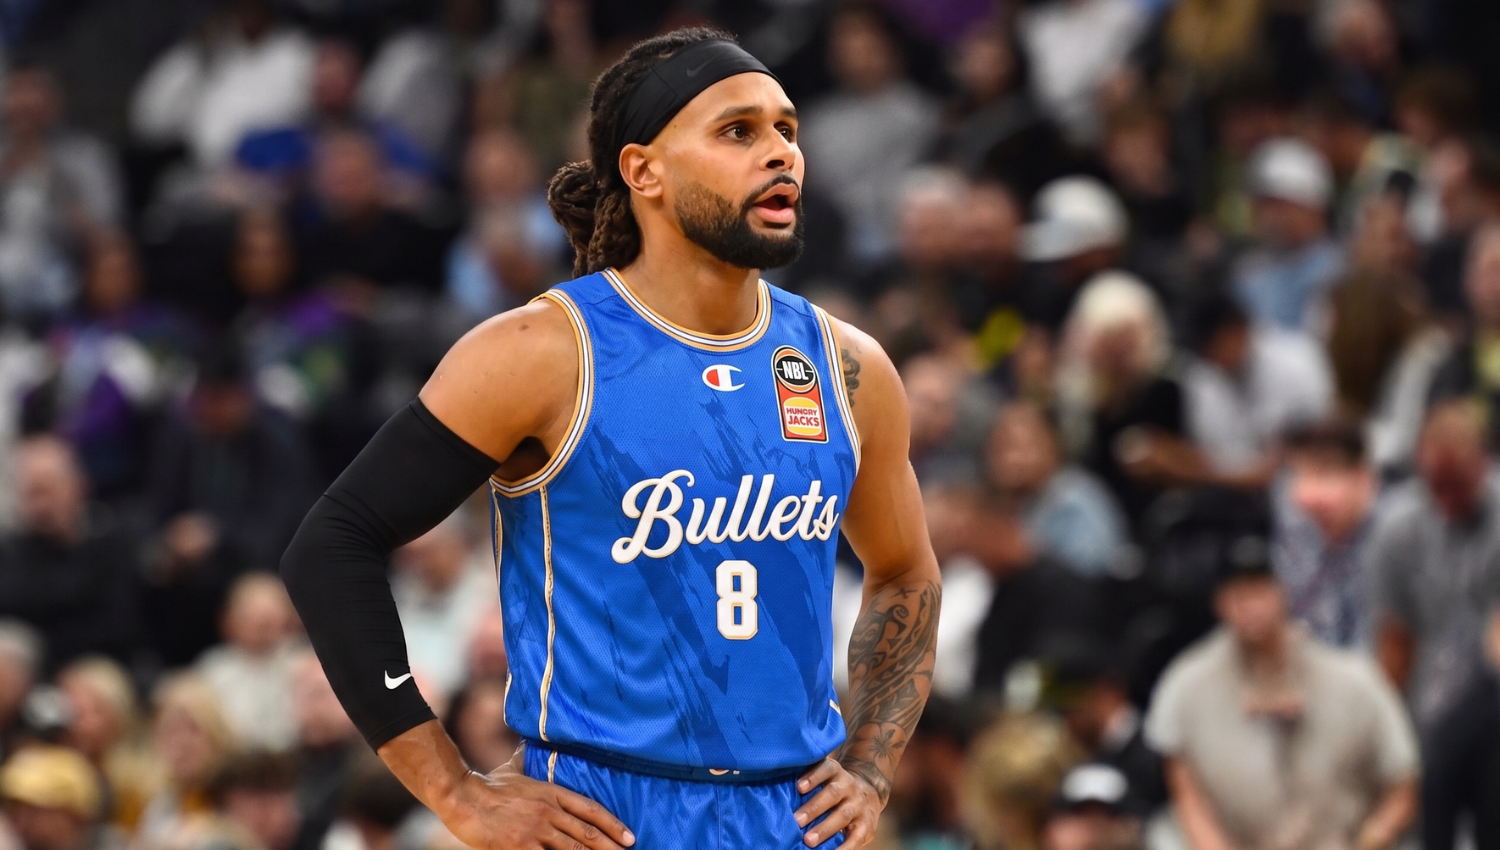
Cotton, 33, is the NBL26 scoring champion, leading the league for 25.7 PPG. It’s the ninth time he’s led the league and the eighth straight. Only Andrew Gaze has done it more times — 14.
Cotton sat out of the 36ers' 86-74 road loss to the Perth Wildcats on Friday, February 20, in Perth.
Although it was easy to look at the overall numbers and see that Cotton led Davis in PPG and APG it wasn't that easy.
Davis' Kings won the head-to-head match-ups against Cotton's 36ers three games to one and the head-to-head individual match-ups, averaging 23.8 points to 16.3.
Bryce Cotton vs Kendric Davis
NBL26 – Side-by-Side Impact Comparison
- Top Six: Sydney Kings │ Adelaide 36ers │ South East Melbourne Phoenix │ Perth Wildcats │ Melbourne United │ Tasmania JackJumpers
- Bottom 4 = New Zealand Breakers │ Illawarra Hawks │ Cairns Taipans │ Brisbane Bullets
Season Box Scores
| Player | GP | PPG  | FG%   | APG | TO  | STL | SC   |
| Davis  | 33 | 24.7 | 48.7% | 7.3 | 2.1 | 1.4 | 44.5 |
| Cotton | 32 | 25.6 | 45.3% | 8.1 | 2.8 | 2.0 | 48.6 |
Team Records vs Top 6
- Sydney: 11–7
- Adelaide: 7–8
| Player | GP | PPG  | FG%   | APG | TO  | A/T | SC   |
| Davis  | 18 | 26.2 | 47.3% | 6.4 | 2.4 | 2.7 | 44.8 |
| Cotton | 15 | 22.2 | 41.2% | 7.9 | 3.5 | 2.3 | 43.8 |
Team Records vs Bottom 4
- Sydney: 13–2
- Adelaide: 16–1
| Player | GP | PPG  | FG%   | APG | TO  | A/T | SC   |
| Davis  | 15 | 22.6 | 50.5% | 8.4 | 1.7 | 4.9 | 44.1 |
| Cotton | 17 | 28.6 | 49.1% | 8.2 | 2.1 | 3.9 | 53.7 |
• Davis scoring increased vs elite teams (+1.5 above season avg)
• Cotton scoring decreased vs elite teams (–3.4 below season avg)
• Davis maintained efficiency; Cotton’s FG dropped ~4%
• Turnovers climbed significantly for Cotton
Both were efficiency-driven in defeat.Davis had fewer inefficient performances.
Head to Head: Bryce Cotton vs Kendric Davis
Oct 11 – Sydney 103 def Adelaide 79
- Davis: 27.5 mins │ 22 pts │ 56.3% FG │ 3 ast │ 3 TO │ 25 SC
- Cotton: 36.5 mins │ 7 pts │ 30.0% FG │ 3 ast │ 2 TO │ 16 SC
Dec 17 – Sydney 97 def Adelaide 93
- Davis: 39.8 │ 27 pts │ 40.0% FG │ 7 ast │ 1 TO │ 51 SC
- Cotton: 45.0 │ 25 pts │ 42.1% FG │ 9 ast │ 5 TO │ 51 SC
Jan 2 – Adelaide 85 def Sydney 79
- Davis: 35.9 │ 26 pts │ 41.7% FG │ 6 ast │ 1 TO │ 44 SC
- Cotton: 39.8 │ 16 pts │ 31.6% FG │ 10 ast │ 2 TO │ 45 SC
Jan 25 – Sydney 106 def Adelaide 101
- Davis: 37.9 │ 20 pts │ 38.9% FG │ 14 ast │ 1 TO │ 68 SC
- Cotton: 39.8 │ 17 pts │ 41.7% FG │ 9 ast │ 5 TO │ 36 SC
| Player | GP | PPG  | FG%   | APG | TO  | A/T | SC   | Team Record |
| Davis  | 4  | 23.8 | 44.2% | 7.5 | 1.5 | 5.0 | 47.0 | 3–1         |
| Cotton | 4  | 16.3 | 36.4% | 7.8 | 3.5 | 2.2 | 37.0 | 1–3         |
• Davis outscored Cotton by +7.5 PPG
• Davis had half the turnovers
• Davis’ Assist/Turnover ratio more than doubled Cotton’s
• Sydney went 3–1 in the match-up
• Cotton never cleared 25 points in any of the four meetings
Defensive Difficulty Index (DDI)
To weight scoring difficulty, we calculate:
DDI Score = Player PPG × (League Avg Pts- ÷ Opp Pts-)
League average Pts- = 2,991
Lower Opp Pts- (better defence) increases weighting.
Bryce Cotton: Weighted Average DDI 25.0
| Opponent    | PPG  | Opp Pts- | DDI Score |
| Kings       | 16.3 | 2,879    | 16.9      |
| Perth       | 19.7 | 2,840    | 20.8      |
| JackJumpers | 22.0 | 2,884    | 22.8      |
| United      | 24.0 | 2,905    | 24.7      |
| SEM         | 24.8 | 3,061    | 24.3      |
| Breakers    | 32.7 | 3,058    | 31.9      |
| Hawks       | 25.0 | 3,205    | 23.3      |
| Taipans     | 38.7 | 3,194    | 36.2      |
| Bullets     | 26.0 | 3,196    | 24.3      |
Kendric Davis: Weighted Average DDI 24.6
| Opponent    | PPG  | Opp Pts- | DDI Score |
| Perth       | 31.0 | 2,840    | 32.6      |
| United      | 26.0 | 2,905    | 26.8      |
| 36ers       | 23.8 | 2,890    | 24.6      |
| JackJumpers | 23.0 | 2,884    | 23.9      |
| SEM         | 30.3 | 3,061    | 29.6      |
| Breakers    | 19.3 | 3,058    | 18.8      |
| Hawks       | 22.5 | 3,205    | 21.0      |
| Taipans     | 25.0 | 3,194    | 23.4      |
| Bullets     | 21.8 | 3,196    | 20.4      |
Kendric Davis
- Top 5 defences: 25.9 PPG
- Bottom 5 defences: 23.8 PPG
- FG% drop minimal (~3%)
Bryce Cotton
- Top 5 defences: 20.5 PPG
- Bottom 5 defences: 29.4 PPG
- FG% drop ~8% vs top teams
Davis’ efficiency is more stable across tiers.Cotton's efficiency varied more by opponent strength.
| Metric                       | Davis            | Cotton             |
| Correlation (PPG vs Pts-)    | –0.28            | +0.62              |
| Avg PPG vs Top 5 Defenses    | 25.9             | 20.5               |
| Avg PPG vs Bottom 5 Defenses | 23.8             | 29.4               |
| FG% vs Top 5                 | 47.3%            | 41.2%              |
| FG% vs Bottom 5              | 50.5%            | 49.1%              |
| Weighted DDI Score           | 24.6             | 25.0               |
| Scoring Stability            | High             | Volatile           |
| Defensive Scaling Profile    | Elite-Responsive | Matchup-Responsive |
Kendric Davis – 30+ Point Games (NBL26)
Total: Seven of Davis’ nine 30-point games came against the Top 6.
- Oct 23 vs South East Melbourne Phoenix – 31 pts (57.1% FG)
- Nov 3 vs Melbourne United – 34 pts (52.0% FG)
- Dec 12 vs Perth Wildcats – 38 pts (56.0% FG)
- Jan 5 vs South East Melbourne Phoenix – 30 pts (84.6% FG)
- Jan 22 vs Tasmania JackJumpers – 40 pts (60.9% FG)
- Feb 1 vs Cairns Taipans – 33 pts (46.2% FG)
- Feb 8 vs South East Melbourne Phoenix – 30 pts (61.1% FG)
- Feb 15 vs Perth Wildcats – 30 pts (64.7% FG)
- Feb 20 vs Brisbane Bullets – 31 pts (86.7% FG)
Bryce Cotton – 30+ Point Games (NBL26)
Total: Six of Cotton’s 30-point games came against the Bottom 4.
- Sep 28 vs Brisbane Bullets – 39 pts (60.9% FG)
- Oct 18 vs Cairns Taipans – 53 pts (55.2% FG)
- Nov 16 vs Cairns Taipans – 41 pts (40.7% FG)
- Nov 19 vs Illawarra Hawks – 31 pts (50.0% FG)
- Dec 12 vs Melbourne United – 33 pts (41.7% FG)
- Dec 28 vs Perth Wildcats – 36 pts (58.3% FG)
- Jan 18 vs South East Melbourne Phoenix – 30 pts (50.0% FG)
- Jan 23 vs New Zealand Breakers – 33 pts (52.4% FG)
- Feb 14 vs New Zealand Breakers – 42 pts (53.8% FG)
The Verdict
| Category                      | Davis    | Cotton | Edge          |
| ----------------------------- | -------- | ------ | ------------- |
| Games Played                  | 33       | 32     | —             |
| Team Record                   | 24–9     | 23–10  | Davis         |
| PPG                           | 24.7     | 25.6   | Cotton        |
| FG%                           | 48.7%    | 45.3%  | Davis         |
| APG                           | 7.3      | 8.1    | Cotton        |
| Turnovers                     | 2.1      | 2.8    | Davis         |
| Assist/TO                     | 3.5      | 2.9    | Davis         |
| SC Average                    | 44.5     | 48.6   | Cotton        |
| 30+ Games                     | 9        | 9      | Even          |
| 40+ Games                     | 1        | 3      | Cotton        |
| 50+ Games                     | 0        | 1      | Cotton        |
| PPG vs Top 5 Defenses         | 25.9     | 20.5   | Davis         |
| FG% vs Top 5                  | 47.3%    | 41.2%  | Davis         |
| PPG vs Bottom 5               | 23.8     | 29.4   | Cotton        |
| Correlation (PPG vs Opp Pts-) | –0.28    | +0.62  | Davis         |
| Weighted DDI Score            | 24.6     | 25.0   | Slight Cotton |
| Head-to-Head Record           | 3–1      | 1–3    | Davis         |
| Head-to-Head PPG              | 23.8     | 16.3   | Davis         |
| Scoring Volatility            | Low      | High   | Davis         |
| Ceiling Games (40+/50+)       | Moderate | Elite  | Cotton        |
So, what’s the takeaway?
If MVP voters lean toward performance against elite competition, it’s advantage for Davis.
If MVP voters lean toward offensive ceiling and total scoring dominance, Cotton is a six-time MVP.
The last word belongs to the seven-time NBL Coach of the Year and six-time championship coach.
“I’m going to go here — it’s not about the MVP,” Goorjian said.
“It’s about Kendrick. I’ve been in this a long time — China, Philippines, Japan, national teams with Japan, national teams with China, Australia — since 1986. I haven’t had a better one.
“Finishing first and talking about the grind — he had a rough year last year. There was a lot swirling around him. We were both kind of in the same bucket. Getting barbecued by everybody.
“How he’s been through all that — loyal, hardworking, team. Tonight, he could have tried to get 40. He’s looking at me like, ‘Get me out of here, get these guys in’. He’s not about his points. He’s about winning.
“His level of play on both sides of the ball — scoring the ball — he’s a tremendous basketball player and tremendous person. A lot of our success is to do with him.”
Goorjian is 100% right. The judges didn't agree.


.jpg)


.jpg)